Candlestick Patterns in the Stock Market

In the world of stock trading, knowledge is power. To succeed in the market, investors and traders must equip themselves with tools that help them make informed decisions. One such tool that has stood the test of time is candlestick patterns. Candlestick patterns are not just about pretty shapes on a chart; they are a visual representation of market sentiment and can provide valuable insights into potential price movements. In this blog, we’ll delve into the fascinating world of candlestick patterns, exploring their history, key patterns, and how they can be used to enhance your trading strategies.
A Brief History of Candlestick Patterns
Candlestick charts have a long and storied history, originating in Japan in the 18th century. They were first used by rice traders to track price movements and predict future price trends. Steve Nison, an American trader, introduced Candlestick Patterns to the Western world in the early 1990s through his book, “Japanese Candlestick Charting Techniques.” Since then, candlestick patterns have become an integral part of technical analysis in the global financial markets.
Understanding the Anatomy of a Candlestick
Before we dive into specific candlestick patterns, let’s understand the basic anatomy of a candlestick:
1. Body
The rectangular area between the open and close prices. If the close is higher than the open, the body is typically filled (colored) and represents bullish sentiment. Conversely, if the open is higher than the close, the body is hollow (white or clear) and represents bearish sentiment.
2. Wicks or Shadows
Thin lines that extend above and below the body, representing the high and low prices during the trading period.
Key Candlestick Patterns
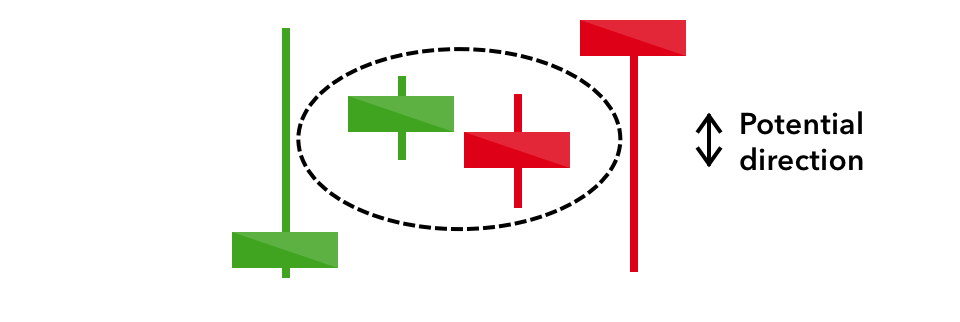
1. Doji
The Doji is a crucial candlestick pattern that signals market indecision. It has a small body, indicating that the opening and closing prices were very close or identical. Dojis can signify potential trend reversals.
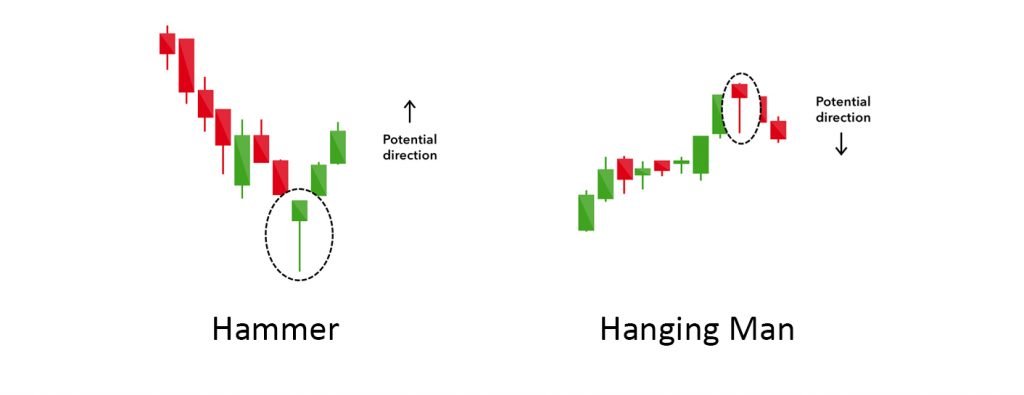
2. Hammer and Hanging Man
These patterns are characterized by a small body near the top (Hammer) or bottom (Hanging Man) of the candlestick, with a long lower wick. Hammers suggest a potential bullish reversal, while Hanging Man patterns hint at a bearish reversal.
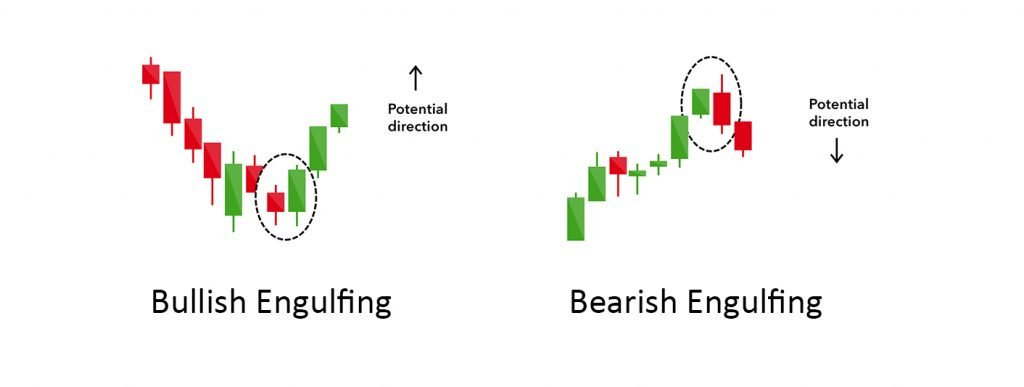
3. Bullish Engulfing and Bearish Engulfing
These patterns involve a smaller candlestick being engulfed by a larger one in the opposite direction. Bullish Engulfing signals a potential bullish reversal, while Bearish Engulfing suggests a bearish reversal.
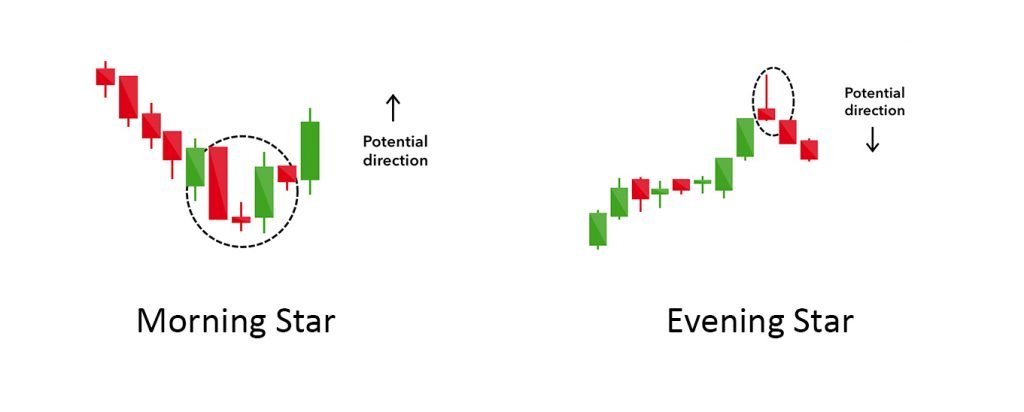
4. Morning Star and Evening Star
These are three-candle patterns that signify potential reversals. The Morning Star consists of a large bearish candle, a small bullish or bearish candle (the star), and a large bullish candle. The Evening Star is the reverse, signaling a potential bearish reversal.
Candlestick Patterns in Trends
Candlestick patterns can also help traders within established trends. For instance, “Bullish Continuation” patterns like Bullish Harami and Bullish Three White Soldiers can confirm upward trends, while “Bearish Continuation” patterns like Bearish Harami and Bearish Three Black Crows can confirm downward trends.
Using Candlestick Patterns in Your Trading Strategy
While understanding candlestick patterns is essential, it’s equally important to use them in conjunction with other technical and fundamental analysis tools. Here are some tips for incorporating candlestick patterns into your trading strategy:
- Confirmation: Don’t rely solely on candlestick patterns; use them to confirm other indicators and signals.
- Timeframes: Consider different timeframes when analyzing candlestick patterns. Patterns on longer timeframes carry more weight.
- Risk Management: Always have a risk management strategy in place to protect your capital.
- Continuous Learning: Keep studying and practicing to improve your ability to recognize and interpret candlestick patterns effectively.
Conclusion
Candlestick patterns are a powerful tool for traders and investors, offering insights into market sentiment and potential price movements. However, they are not infallible, and it’s crucial to use them in conjunction with other forms of analysis and risk management. By mastering the art of reading candlestick patterns, you can illuminate your path to success in the complex world of the stock market.